Do #dogs make us and our lives better? I have done an #illustration on the #stats across US. #infographic #doggylove

Ideas before Urbino
Have found my notes from before the Urbino Summer School last summer. Contains some ideas that I never actually realised!

A view from our hotel in Falconara Maritima - the morning before the School began.
Ideas before Urbino
15-Jul Taking a walk for a line - if I could only use one line to describe Urbino, what could that line be?
13-Jul Modernism and postmodernism exist together and influence one another. There's no changing of fashion.
13-Jul
Vignelli: three aspects of design - Semantic, Syntactic and Pragmatic
Design is one - it is not many different ones
White, in typography, is what space is in Architecture.
Light is the master of form and texture
10-Jul Combining both the architectural and the painterly, the space itself was meant to act as material and to become the support medium of the installation
10-Jul Urbino: a research into the experience of built space and of building materials in their sensory aspects.
http://en.m.wikipedia.org/wiki/Phenomenology_(architecture)
07-Jul Intro: I draw and I go graphic design, and I use both those disciplines as methods for analysis. Now, there are many things that can be analysed visually, and here I've collected some of them.
06-Jul semiotics as a method focuses our attention on to the task of tracing the meanings of things back through the systems and codes through which they have meaning and make meaning. (Slater, 1995, p. 240)
05-Jul Teaching of Kandinsky - analytical drawing: Schematic drawing, Compositional diagram, Characterisation of objects, constructive analysis, geometrical connections and linear analysis
05-Jul Best drawings are done when I look into my feelings and analyse them in my drawing try to find the marks and method express my emotion. Graphic design can also be applied analytically to explore emotion/subject matter.
05-Jul
Design for analysis, including analysis of:
* Information (data vis)
* Structure (books, etc.)
* Form
* Content
30-Jun Ideas for Drawing techniques:
* drawing made by folding, tearing, cutting (maybe paper different colours)
* drawing+projection
* thaumatrope
* The project researches the interplay of perception and memory in ordinary experience of reality and adopts drawing as a language of visualisation outlining the structures and grammar of the phenomenon ( Maria Teresa Ortoleva)
29-Jun The early stages of a science must be dominated by empirical work, that is, the accumulation and classification of data. Only as a discipline matures can an adequate body of theory be developed. - Walliman, N., 2001. P.83
29-Jun Georges Braque: Seek for common in dissimilar.
29-Jun Drawing = motor factor+Visual organization (Flashlight drawings by Picasso)

29-Jun Make a map drawing of all my movements around Urbino during two weeks. Make a GPS drawing by moving around town.
29-Jun Drawing as analytical tool - plan/map, unmotivated looking, drawings based on drawings, or drawings as analysis of drawings or other types of data collection.
28-Jun Urbino - make icons/ symbols based on street sketching. Also, make a black square - as a sign that graphic art has gone into a circle and started repeating itself from 100 years ago.
Urbino - collect all icons, mix icons and drawings
Also try to make nonrepresentational street sketching - eg making a different kind of notation on the paper. Scratch, put charcoal on found icons and make prints.
Also black square means that this 100 years have ended - and now it's time for different graphic art, although deeply rooted in that era. Non conceptual? Simply mine?..
Think as when doing computer graphics, but express it with means of drawing
Sample problem definition: How does drawing help us learn?
Make referential drawings: cognitive aspect of images won't change if the constituent elements are to be rearranged. Eg gather all vertical etc - add a level of abstraction. Also make Infographic drawings, eg draw the data conveyed in the drawing, how much light, space is there, etc.May be do a plan/map of some kind.Make several drawing with different amount of abstraction - from very subtle to extremely wild.
Drawing facilitates analysis.
Do a series from one stencil - white square, with white spray paint (so that it was a bit visible that part of area is covered). And a black square. And then when they are displayed together you'll have a nice after image from black square, to make white lighter than the paper on white square.
27-Jun That's why we call a drawing a 'study'. Drawing studies seeing in the same way as music studies hearing, architecture studies our perception of space, perfumery studies how we smell and fashion studies our sense of touch (as we touch our clothes all the time and touch our surroundings through the clothes).
Learning aspect of drawing/images is very much underestimated in contemporary culture and could contribute immensely to learning if thoroughly researched and fully employed. (Including digital means.)
Drawing as experience: when we read, we learn from someone else's experience, but when we look at the image, we learn from our own. This is why learning from images is easier and more direct.
26-Jun We always learn from images. When we read, our brain constructs a mental image of a subject described, and then learns from it. The same with numbers, brain has to combine numbers in one coherent image before it can analyse them. When the image is readymade, brain can learn directly, without having to transform words or numbers mentally.
Emotions/essences described when reading -> expression in images.
Drawing and Cognition - learning through drawing, learning through creating images
19-Jun It is from first words in a book, when you start to read it, you understand what this book is going to be about.
End of Form - a story in drawings
Mario Garcia: When sketching by hand was the only way


A font for building charts: FF Chartwell
Such a great idea, to use OpenType technology to convert math formulas to actual visualization! Have yet to test it - but thank you very much to my colleague Jim Kynvin for spotting it! Font is made by FontFont: here's the source link.

Photo from Urbino Summer School
Just heard from Ilaria Ruggeri, who sent this nostalgic photo of our group from WT/ISIA Urbino Summer School in July. Fun times these were! Thank you for tutors and fellow Summer Schoolers!

Territory Studio: Icons for The Guardian
A sparkling example of how deep an icon starts to look when you place a grid behind it, although in this case, these are masterfully designed icons! Here's a link to the full presentation. #guardian #icons


New Norwegian banknotes

Source: Norges Bank
Four Golden Rules of Successful Graphic Design
If you want to succeed as a graphic designer in the digital age, follow these four simple rules (will have to make this as an infographic, as a parody to all those funny infographics online): 1. Always change the colours of your design to the ones opposite to what client has in their branding. 2. Select the most obscure free font you can find online, so that no one else could open your designs without seeing it with fonts switched off. 3. Make the design too big or too small to watch on screen. 4. Most importantly, don't forget to grumble that clients are idiots who don't understand anything!
Vignelli canon: use of fonts
In the new computer age, the proliferation of typefaces and type manipulations represents a new level of visual pollution threatening our culture. Out of thousands of typefaces, all we need are a few basic ones, and trash the rest. The Vignelli Canon, p. 56
Logos
For many years now, I haven’t done a single logo. The reason for that may be that every time a client wanted a logo I'd say something silly like ‘If you don’t have identity a logo won’t help you’ – after which the client would walk away. This has not been a very responsible behavior on my side – and I decided to change my mind. Now I think I should do logos, even if I don’t know why I do them, because, as I now believe, if you keep on looking, you will finally find out what is it that you’re looking for.
Space as material
In phenomenology, the environment is concretely defined as "the place", and the things which occur there "take place". The place is not so simple as the locality, but consists of concrete things which have material substance, shape, texture, and color, and together coalesce to form the environment's character, or atmosphere. It is this atmosphere which allows certain spaces, with similar or even identical functions, to embody very different properties, in accord with the unique cultural and environmental conditions of the place which they exist. Phenomenology is conceived as a "return to things", maneuvering away from the abstractions of science and its neutral objectivity. Phenomenology absorbs the concept of subjectivity, making the thing and its unique conversations with its place the relevant topic and not the thing itself. The man-made components of the environment become the settlements of differing scales, some large—like cities, and some small—like the house. The paths between these settlements and the various elements which create the cultural environment become the secondary defining characteristics of the place. The distinction of natural and man-made offers us the first step in the phenomenological approach. The second is to qualify inside and outside, or the relationship of earth-sky. The third and final step is to assess character, or how things are made and exist as participants in their environment. Source: http://en.m.wikipedia.org/wiki/Phenomenology_(architecture)
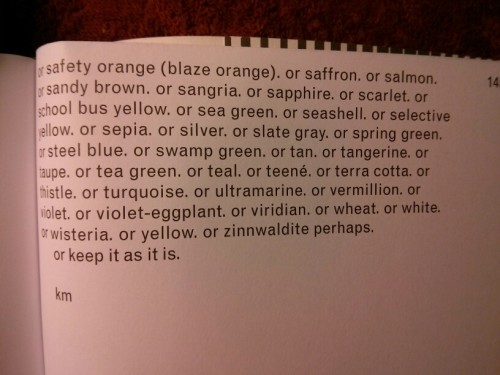
Which colours are Karel Martens' boxes?
- Alice blue
- alizarin crimson
- amber
- amethyst
- aqua
- acquarnarine
- asparagus
- azure
- beige
- bistre
- black
- blue
- Bondi blue
- brass
- bright green
- bright turquoise
- bright violet
- bronze
- brown
- buff
- burgundy
- burnt orange
- burnt sienna
- burnt umber
- camouflage green
- cardinal
- carmine
- carrot
- celadon
- cerise
- cerulean
- cerulean blue
- chartreuse
- chestnut
- chocolate
- cinnamon
- cobalt
- copper
- coral
- corn
- cornflower blue
- cream
- crimson
- cyan
- dark blue
- dark brown
- dark cerulean
- dark chestnut
- dark coral
- dark goldenrod
- dark green
- dark indigo
- dark khaki
- dark olive
- dark pastel green
- dark peach
- dark pink
- dark salmon
- dark scarlet
- dark slate gray
- dark spring green
- dark tan
- dark tangerine
- dark tea green
- dark terra cotta
- dark turquoise
- dark violet
- denim
- dodger blue
- eggplant
- emerald
- fern green
- flax
- fuchsia
- gamboge
- gold
- goldenrod
- gray
- gray-asparagus
- gray-tea green
- green
- green-yellow
- heliotrope
- hot pink
- indigo
- international Klein blue
- international orange
- jade
- khaki
- khaki (X11)
- lavender
- lavender blush
- lemon
- lemon cream
- light brown
- lilac
- lime
- linen
- magenta
- malachite
- maroon
- mauve
- midnight blue
- mint green
- moss green
- Mountbatten pink
- mustard
- Navajo white
- navy blue
- ochre
- old gold
- olive drab
- orange
- orchid
- pale blue
- pale brown
- pale carmine
- Pale chestnut
- pale cornflower blue
- pale magena
- pale pink
- pale red-violet
- pale sandy brown
- papaya whip
- pastel green
- pastel pink
- Paul mauve
- peach
- peach-orange
- peach-yellow
- pear
- Persian blue
- pine green
- pink
- pink-orange
- plum
- powder blue
- Prussian blue
- puce
- pumpkin
- purple
- raw umber
- red
- red-violet
- robin egg blue
- royal blue
- russet
- rust
- safety orange (blaze orange)
- saffron
- salmon
- sandy brown
- sangria
- sapphire
- scarlet
- school bus yellow
- sea green
- seashell
- selective yellow
- sepia
- silver
- slate gray
- spring green
- steel blue
- swamp green
- tan
- tangerine
- taupe
- tea green
- teal
- teené
- terra cotta
- thistle
- turquoise
- ultramarine
- vermillion
- violet
- violet-eggplant
- viridian
- wheat
- white
- wisteria
- yellow
- zinnwaldite
Text source: Full color, Martens, Schwartz. Roma Publications, 2013. P. 143-145

Gender
![]() Icon from a new Google icon set
Icon from a new Google icon set
Sketches for device icons
![]()
The Noun project - a website about icons
A great website with lots of superb iconography - an extermely useful instrument when working on own icons - and for buying icons from designers, too, of course:

Ten most used chart types
(from Digital Agency to Google)
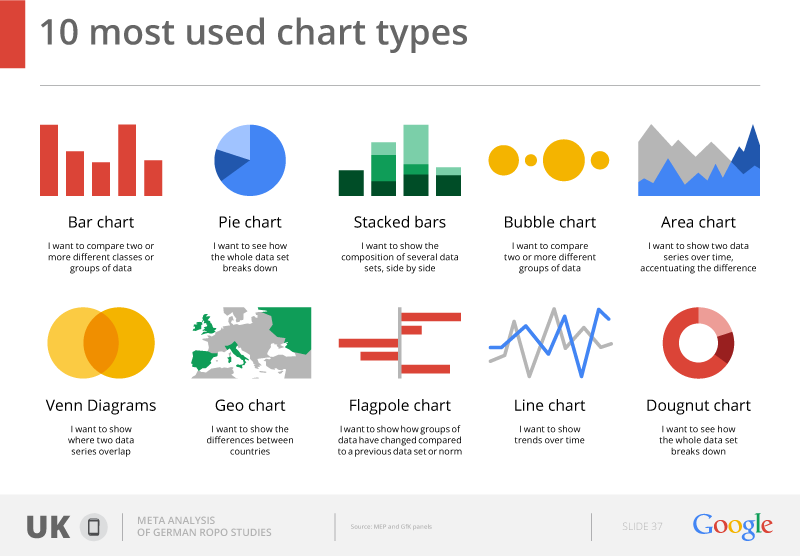
So why do infographics work, then?
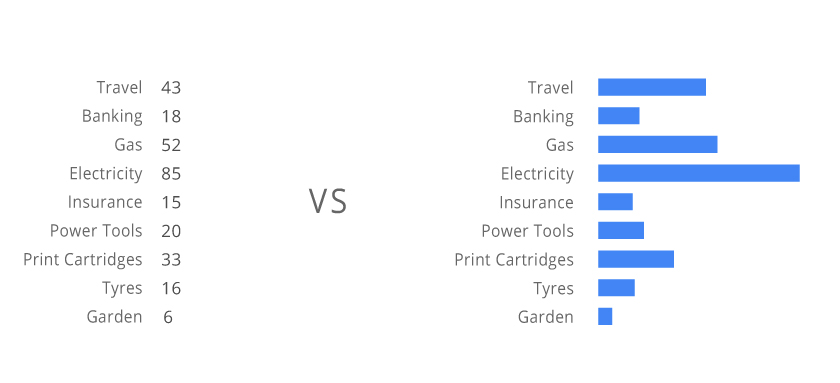 Logically, users are after numbers, because that where the core information is. Why is there a need to visualize the data?
It seems like there is a purely visual mechanism that helps us to understand data in a different way when we look at the image, as compared to just the display of numbers, - a new meaning appears.
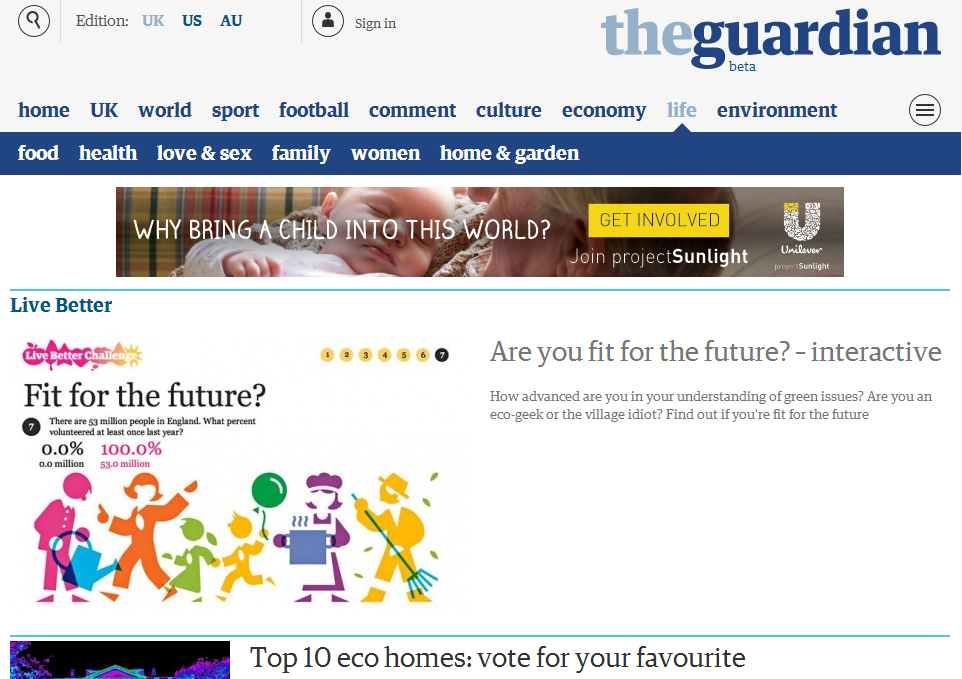
Our interactive for Live Better challenges goes live!
Production: Adam Frost, Rosie Roche, Gabriela VieruDevelopment: Matt Bentley Design and illustrations are by me.
Dangers of London
[gallery columns="4" ids="7209,7210,7211,7212,7213,7214"]
Iconography collected during trip to Thailand
[gallery columns="4" link="file" ids="6524,6525,6526,6527,6528,6529,6530,6531,6532,6533,6534,6535,6536,6537,6538,6539,6540,6541,6542,6543,6544,6545,6546,6547,6548,6549,6550,6551,6552,6553,6554,6555,6556"]