• Graphics
  • Figma
  • Research
  • Newsletter
  • About
  • Contact

Zhenia Vasiliev

  • Graphics
  • Figma
  • Research
  • Newsletter
  • About
  • Contact

We're not in Kansas anymore

China's social networks infographic kansas3_2

Client: Internal presentation Brief: An infographic targeted at 14-year old girl who has to relocate to Shanghai from Kansas because of her parent's work relocation. Ideas: Social networks are one of the teenage girls' highest priorities and are the place where they spend a lot of time. This infographic's problem is that there won't be any familiar social networks available in China, and it offers some information for those who still wants to spend time online with choosing which alternative networks could be used.

The piece is for a presentation so shouldn't occupy more than one screen in height. The data is not real at this point.

categories: research notes
Tuesday 10.01.13
Posted by Zhenia Vasiliev
 

FCA interface project log

fca FCA interface project log

Client: Financial Conduct Authority Brief: Interface and series of infographics on the 10 social segments. Ideas:

1. Interface: Use their 21 degree slanted square as the general interface element and build a kind of slanted bar chart based on their market segmentation. Approved by client: 10 segments with pictures in them (image containers), skewed by 21 degrees and generated from a bar chart, according to percentages of those segments (in bar chart, the widths represent percentages, not the heights, so the height is consistent). Used together, they form a pattern. Roll-over state enlarges the hovered segment and gives the title of it below. Clicking on each segment takes the user to the horizontal infographic, scrollable across 3 or 4 screens (a still image).

2. Infographics: Each of them consists of 4 parts: 1) who are they (doughnut charts); 2) their attitudes (bar charts); 3) their behaviours (bar charts); 4) summary (icons + simplified bar charts).

3. Icons: slanted icons for last sections. Weather allegory for risk of detriment

fca2

Friday, Oct 4th, 2013: Updating the information It was decided to send the photography and colour for each segment for approval prior the data, as there is another specialist working on the photos. We need to get them approved so that he could be sure which photos to work with.

Data for four segments has arrived today. The problem was that now it is not consistent with the original design: instead for 5 and 5 bars on pages 2 and 3, there are now 6 and 5, or 5 and 4 etc. Have decided to put in all of the data as it has arrived and later on adjust the layout when it is approved.

categories: research notes
Monday 09.30.13
Posted by Zhenia Vasiliev
 

Calendar sketches

calendar_sketches calendar_sketches2

tags: pencil, sketch, sketchbook, urban sketchers
categories: photos, research notes
Thursday 09.19.13
Posted by Zhenia Vasiliev
 

Preliminary sketches for Education UK's Slang brochure

Slang-brochure-v01_p8-9 Slang-brochure-v01_p8-9

Directives: come up with an image that would be easy to change and tweak around, it would also answer the British Council's general tone for all imagery. The hard bit here is that they don't have anything on neither iconography nor illustration in their branding (only photos could normally be used), so this is questionable if such approach will be approved.  Among other considerations, it was decided to do it in black and white, and graphically simple, to oppose the photographic row.


tags: British Council, brochure, Education UK, illustration, sketch, Slang
categories: research notes
Monday 09.16.13
Posted by Zhenia Vasiliev
 

DVD remote interface redesign

Original DVD remote and my attempt to redesign it:

original DVD remote

image

Sample task models (even these level of roughness helped a lot):wpid-wp-1378636433474.jpg

Basically, my solutions leaves only the elements you need to access directly while watching videos: "play" (/pause when pressed again), "volume", "brightness", "subtitles" and "menu". The rest of functionality can be made accessible through the menu (hence the arrows, plus "enter"). On top is power on/off and eject/inject.

Try it yourself - here's the link

categories: research notes
Sunday 09.08.13
Posted by Zhenia Vasiliev
 

Storyboard for Barclays

One of a series, following a general style developed by Caroline Leprovost:barclays_transition_storyboard

tags: Barclays, da, guardian, illustration, Storyboard, vectors
categories: research notes
Wednesday 08.28.13
Posted by Zhenia Vasiliev
 

Royal baby newspaper

royalbaby_newspaper

tags: baby, newspaper, royal, scan
categories: research notes
Friday 08.23.13
Posted by Zhenia Vasiliev
 

Screenshots of 39 Stats infographic on The Guardian website

Facebook shares reached 2969 on Tuesday 27th August.Link to the graphic on the Guardian website.

The infographic has also been reposted on the following websites: Slate.com
co.create

co.create [again], this time with an interview by John Brownlee

Screen Shot 2013-08-12 at 20.18.45

Screen Shot 2013-08-12 at 20.21.42

Screen Shot 2013-08-12 at 20.22.02

tags: 39 Stats, Adam Frost, hitchcock, infographic, Screenshots, The Guardian, website
categories: reference, research notes
Thursday 08.22.13
Posted by Zhenia Vasiliev
 

Infographic 101 project log

infographic-101-screenshot-220813-10-21 
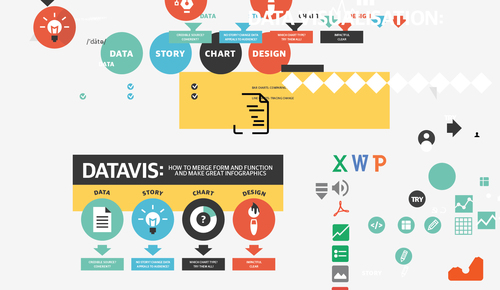
Version 1. The initial idea is to do an infographic about how to do an infographic, and test out the 'flat iconography' aesthetics (along the lines of Google and Mailchimp's flat icon design). Initial data set consisted on four main parts: Data, Story, Chart and Design, so the start point was to select four main colours and to do a wireframe with one big introductory screen and four consequtive parts, each having its own colour, plus gray.

While working on the wireframe, I also thought it could be nice to go really big with all elements, and make the graphic viewable on the mobile screen (but I had to complete the first wireframe before going back to this - I want to try out a separate mobile version, with a really narrow artboard).

Follow-up ideas: make a supplementary (black-an-white, derived from Google's flat icons) icon set, and use consistent height/width rectangles for each of the sections.

Structure: Part 1 - introduction (data, story, chart, design). Parts 2-5: 1) term, class of word (noun,verb), transcription; term definition ("data is Facts and stats collected together for reference or analysis"); 2) supplementary field (e.g. 'analysing your data'): icon, 2-deck subhead, 3-4 lines of text; 3) Professionals field (e.g., Designer, Data Analyst); 4) Tools field (e.g. Microsoft Excel, Adobe Illustrator); 5) Try it! field: 1-deck heading + 2 or 3 tick-marked 2-deck slogans (e.g. "MARKING UP A SPREADSHEET", "SKETCHING CHARTSWITH KEY DATA").

Next step: mobile version on a narrow artboard, especially intro screen with big header and four icons.

tags: 101, illustrator, infographics, project log, vector
categories: research notes
Thursday 08.22.13
Posted by Zhenia Vasiliev
 

Corfe castle ticket

Scan

categories: photos, research notes
Tuesday 08.20.13
Posted by Zhenia Vasiliev
 

Sketches for Hitchcock infographic by Adam Frost

adam_sketch_hitch1 adam_sketch_hitch2

adam_sketch_hitch3

by Adam Frost

categories: photos, research notes
Monday 07.15.13
Posted by Zhenia Vasiliev
 

Birthday note from Dynamic Futures!

birthday_df

tags: birthday, Dynamic Futures, note
categories: research notes
Monday 07.08.13
Posted by Zhenia Vasiliev
 

Cow sketch

tags: calendar, cow, pencil, sketch
categories: photos, research notes
Thursday 05.23.13
Posted by Zhenia Vasiliev
 

Calendar sketches

tags: calendar, pencil, sketches
categories: photos, research notes
Tuesday 05.21.13
Posted by Zhenia Vasiliev
 

Mark McClure exhibition flyer

Scan 9

tags: Artist, design, exhibition, flyer, graphic art, guardian, mark
categories: photos, research notes
Wednesday 05.15.13
Posted by Zhenia Vasiliev
 

Work of chance

A random infogrpaphic created by dragging things out from the artboard:

tags: artboard, chance, design, illustrator, infographic, Work
categories: research notes
Friday 05.03.13
Posted by Zhenia Vasiliev
 

Welcome papers from Sony

categories: research notes
Wednesday 03.06.13
Posted by Zhenia Vasiliev
 

Lab tag from Science Museum last week (Google Labs)

tags: Google, Lab, Labs, london, Science Museum, tag
categories: research notes
Friday 02.15.13
Posted by Zhenia Vasiliev
 

"What's in a name?"

A new infographic by the genius Adam Frost and me on the Guardian website: http://www.guardian.co.uk/news/datablog/gallery/2013/feb/11/whats-in-a-name

tags: Adam Frost, guardian, infographic, name
categories: reference, research notes
Monday 02.11.13
Posted by Zhenia Vasiliev
 

The Moscow News Happy New Year video (:

tags: Happy New Year, the moscow news, video
categories: research notes
Wednesday 01.09.13
Posted by Zhenia Vasiliev
 
Newer / Older

Zhenia Vasiliev © 2025