• Graphics
  • Figma
  • Research
  • Newsletter
  • About
  • Contact

Zhenia Vasiliev

  • Graphics
  • Figma
  • Research
  • Newsletter
  • About
  • Contact

Moonscape's The Future We Have All Been Waiting For is out today!

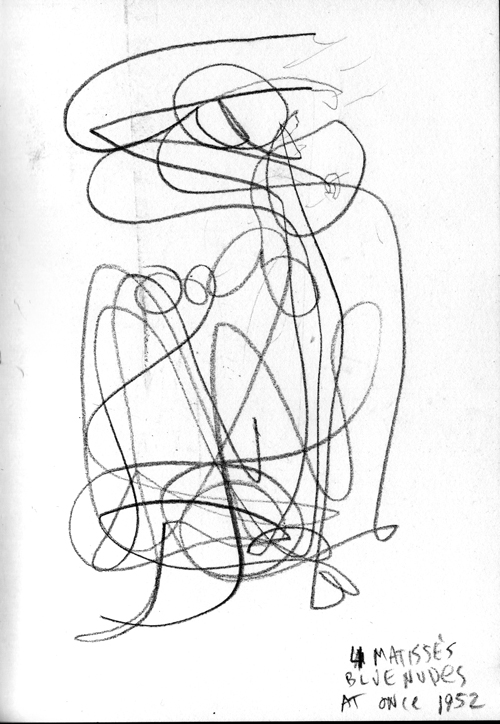
A new major collaboration from me and electronic musician Moonscape: his new album The Future We Have All Been Waiting For which is out today and a series of nine drawings I made for it (one per track).

Listen to the music: https://play.spotify.com/album/26j123jxGvGqpJsnAt3dDx
And look at my drawings while you do:http://www.evasilev.com/drawing/#/tfwhabwf/

Congratulations to Daniil Aleksandrov!

tags: music, electronic, moonscape, drawing, experimental
categories: research notes
Thursday 11.27.14
Posted by Zhenia Vasiliev
 

Equations: Marcel Duchamp, Marchant du sel

I quite like the idea of an equation, because it doesn't point only to art or to science, but has that universal kind of feel for any aspect of life. Artist is of course an equation with his art, meaning that an artist is not balanced if she does not create. But so is everybody else - any person finds its own approach, their own process  that balances things out, to get to that cosmic equation that is so much spoken of in Nature and in human mind, and in relation of the two.

Equation, in turn, is a mathematical concept which lends itself quite logically to visual representation. This is a thing to think about, but here's a quick sketch made the other day of some kind of logical construction found in real life:

upload.jpeg

Basically, two dudes covering the roof of a building - one below, another on the top. The circular motion of the bucket connects the two, and so does their own co-motions. The lower man goes to the car on our right to fill the bucket, the top man goes to the left out of the picture to do the roof work. Then the process repeats.

tags: urban sketchers, sketches, drawing, equation, papercut, charcoal, mathematical, math
categories: research notes
Thursday 11.20.14
Posted by Zhenia Vasiliev
 

Our Insults infographic goes live!

Which insults are most offensive? Adam Frost and I have looked at the data behind rude words:http://www.buzzfeed.com/adamfrost72/great-british-insults-which-words-are-the-most-of-147xc?s=mobile

tags: infographic, illustration, punk, bullocks, data, books, swearing, words, insults, rude
categories: research notes
Tuesday 11.18.14
Posted by Zhenia Vasiliev
 

Pastel smudgings

tags: drawing
categories: photos, research notes
Sunday 11.16.14
Posted by Zhenia Vasiliev
 

The Infographics Atlas has arrived!

With our piece about Hitchcok films in it. Congrats @adamfrostuk and a big thank you to @srendgen!

View fullsize IMG_20141115_101456_2.jpg
View fullsize IMG_20141115_101640_2.jpg
View fullsize IMG_20141115_101811_2.jpg
tags: taschen, hitchcock, illustration, book, infographic
categories: research notes
Saturday 11.15.14
Posted by Zhenia Vasiliev
 

Sketches from yesterday

faces1114.jpg

Pastel

tags: drawing
categories: research notes
Sunday 11.09.14
Posted by Zhenia Vasiliev
 

Hitchcock graphic in the book

Our Hitchock infographic appears in the Taschen new Infographics book!

Infographic infamy at Graphic Towers! pic.twitter.com/wPDmBbAwmw

— Aimée Stewart (@NativesAgency) November 5, 2014
tags: book, infographics, hitchcock
categories: research notes
Thursday 11.06.14
Posted by Zhenia Vasiliev
 

Forming an argument

1. Drawing and graphic design have a lot in common. Therefore, a study in drawing has a big impact on graphic design practice.

2. Drawing is phenomenological, which means that it is capable of telling not only about the subject of drawing, but about the process as well. ->

3. Both the process and the subject are equally important for the drawing.

4. Drawing is rigorous in following its rules, therefore much of drawing is instructed by itself, as well as from the outside.->

5. Involvement into the drawing from the outside should be minimized, so that the inside rules of the drawing were stronger and easier to use.

tags: argument, walliman, research, drawing
categories: research notes
Sunday 10.12.14
Posted by Zhenia Vasiliev
 

A collection of visual responses to Matisse's cutouts

All of the Matisse's Blue Nudes combined into one:blue_nudes_combined_0914

[gallery columns="4" ids="7636,7637,7638,7639,7640,7641"]

tags: cut-out, exhibition, experience, matisse, modern, pencil, response, sketch, sketchbook, Tate
categories: photos, research notes
Monday 09.22.14
Posted by Zhenia Vasiliev
 

Four Golden Rules of Successful Graphic Design

If you want to succeed as a graphic designer in the digital age, follow these four simple rules (will have to make this as an infographic, as a parody to all those funny infographics online): 1. Always change the colours of your design to the ones opposite to what client has in their branding. 2. Select the most obscure free font you can find online, so that no one else could open your designs without seeing it with fonts switched off. 3. Make the design too big or too small to watch on screen. 4. Most importantly, don't forget to grumble that clients are idiots who don't understand anything!

tags: design, ideas, notes, rules, thoughts
categories: research notes
Sunday 09.14.14
Posted by Zhenia Vasiliev
Comments: 2
 

Appropriate wording

- "The worst is better than the best because it can't get any worse"- "Old is the new new"

tags: words
categories: research notes
Wednesday 09.10.14
Posted by Zhenia Vasiliev
 

Movement tracking on St Pancras station

Movement tracking St Pancras 1, 2 and 3, pencil, 2014Drawings were done standing opposite the exit from the trains on St. Pancras station.

In this experiment I wanted to trace the movement of people coming towards me:

stpancras_people_tracking

The idea for two following ones was to represent the shape of a moving crowd, to further investigate its visual impact:

stpancras_people_tracking2 stpancras_people_tracking3

tags: drawing, london, pancras, pencil, urban sketchers
categories: photos, research notes
Monday 08.25.14
Posted by Zhenia Vasiliev
 

RGB primaries: a test

irrational_beliefs

tags: primaries, rgb
categories: research notes
Thursday 08.14.14
Posted by Zhenia Vasiliev
 

A day in the Life of Urbino

A short animation created during WT/ISIA 2014 summer school in Urbino, Italy [youtube=http://youtu.be/j3JC8bocmi0&w=900]

tags: animation, charcoal, drawing, ISIA, research, summer school, urbino, WT
categories: research notes
Sunday 08.10.14
Posted by Zhenia Vasiliev
 

Urbino icons

[gallery columns="4" ids="7519,7520,7521,7522,7523,7524,7525,7526,7527,7528"]

tags: icons, italy, urbino
categories: photos, research notes
Wednesday 08.06.14
Posted by Zhenia Vasiliev
 

Place where we stayed during WT/ISIA summer school

Student dormitories of the Collegio del Colle (1962-66), designed by Giancarlo De Carlo: Urbino, Italy [gallery columns="4" ids="7494,7495,7496,7497,7498,7499,7500,7501,7502,7503,7504,7505,7506,7507,7508,7509,7510,7511,7512,7513,7514,7515,7516"]

tags: brutalist, dormitory, study, summer school, urbino, WT
categories: photos, research notes
Sunday 08.03.14
Posted by Zhenia Vasiliev
 

Logos

For many years now, I haven’t done a single logo. The reason for that may be that every time a client wanted a logo I'd say something silly like ‘If you don’t have identity a logo won’t help you’ – after which the client would walk away. This has not been a very responsible behavior on my side – and I decided to change my mind. Now I think I should do logos, even if I don’t know why I do them, because, as I now believe, if you keep on looking,  you will finally find out what is it that you’re looking for.

tags: design, logo, method, Process
categories: research notes
Thursday 07.17.14
Posted by Zhenia Vasiliev
 

Gender

Google_icons_ppt_04-73Icon from a new Google icon set

tags: agency, design, gender, graphic, iconography, yellow
categories: research notes
Thursday 07.10.14
Posted by Zhenia Vasiliev
 

Sketches for device icons

device_icons

tags: design, Google, iconography, icons
categories: research notes
Friday 07.04.14
Posted by Zhenia Vasiliev
 

Ten most used chart types

(from Digital Agency to Google) 10_most_used_charts

tags: charts, design, digital agency, graphics, infographics
categories: reference, research notes
Thursday 06.26.14
Posted by Zhenia Vasiliev
 
Newer / Older

Zhenia Vasiliev © 2025